Use AppInsight for IIS to monitor an IIS server
SAM includes a set of specially-designed AppInsight templates that you can assign to nodes to monitor key business tools such as Microsoft IIS. These "super templates" include a variety of component monitors that provide a comprehensive level of detail beyond what other templates can provide, allowing you to monitor virtually every aspect of your application.
SAM provides the following AppInsight applications:
This example explains how to assign the AppInsight for IIS template to any WMI node running IIS, which provides you with:
- Control over websites and application pools
- Separate, detailed metrics on each website or pool, instead of just a summary level
- Monitoring log space usage on each website individually, ASP.NET requests monitoring
- SSL expiration monitoring
If you added AppInsight for IIS to a node during Discovery, skip to View IIS application data to get started.
Add AppInsight for IIS to an existing WMI node
- In the SolarWinds Platform Web Console, navigate to the Node Details view of any WMI node running IIS.
You must know which nodes are running IIS.
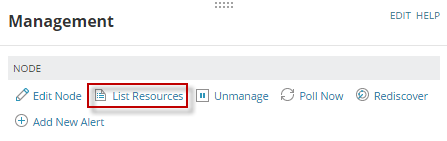
- From the Management widget, click List Resources.
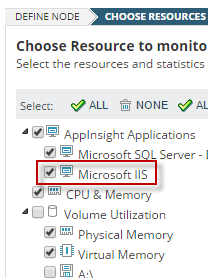
- Select Microsoft IIS to enable AppInsight for IIS data collection, then click Submit.
List Resources shows all monitorable features of a node.
- Click the All Applications widget to verify the addition by clicking the Applications.
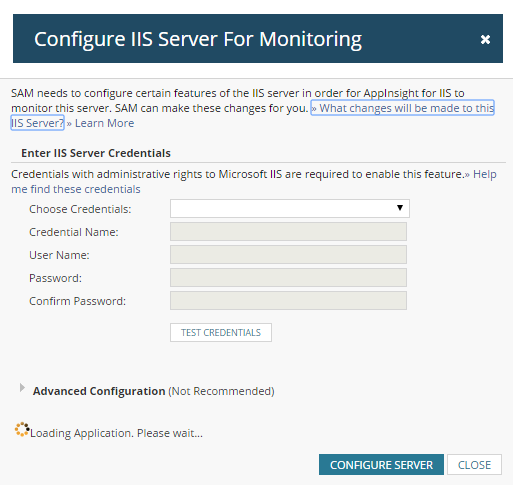
- Enter your IIS credentials when prompted, and click Configure Server.
For troubleshooting information, see Troubleshoot AppInsight for IIS.
View IIS application data
SolarWinds SAM displays IIS data in views. The type of view determines the level of detail. For example, the AppInsight for IIS Details view provides a rollup of information about that IIS server, including statistics about all the sites on the server, application pools, and connections.
Navigate to the AppInsight for IIS Application Details view
- Click My Dashboards >Applications > IIS to open the IIS Application Summary view.
- In the All Applications widget, expand a node, drill down, and click Microsoft IIS to open the Application Details view.
- Click an IIS application to view.
The Applnsight for IIS Application Details view includes different widgets that display details for sites, applications pools, and more. Click hyperlinks in each widget to learn more about the data.
For example, click a website link in the Sites widget to open the IIS Site Details view for that website. To return to the AppInsight for IIS Application Details view, click the Back button in your browser.

Navigate to the Performance Counter Details view
From the AppInsight for IIS Details view, click a performance counter in any widget to open the IIS Statistic Details view for the counter. For example, click ASP.NET > Requests Rejected.

An Expert Knowledge widget appears on IIS Statistic Details view for each performance counter general information about the selected counter, along with possible problems and troubleshooting steps, where applicable. Find expert knowledge on the Performance Counter Details view.

AppInsight for IIS can help you monitor and troubleshoot IIS. However, a software monitoring solution cannot detect failed hardware issues, such as insufficient RAM or a failed cooling fan. To detect hardware issues, enable Hardware Health monitoring.